-
| The user can go through 'Home' and 'Algorithm' menu for understanding the basics behind
the development of this tool and calculation used for specifying the query genes into different
categories based on their expression levels.
|
-
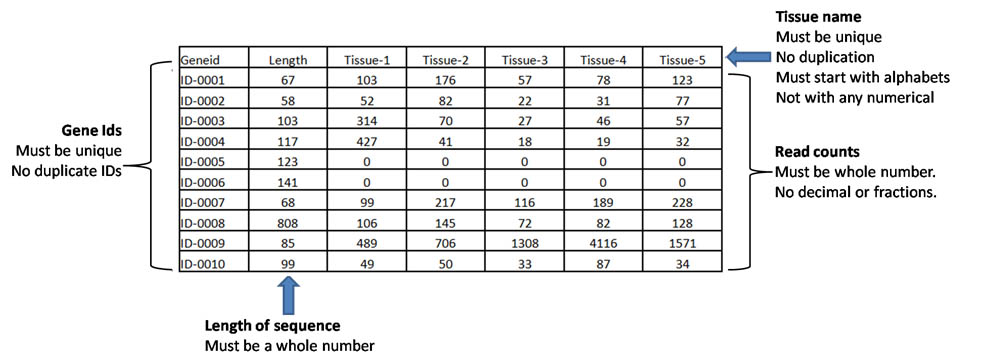
| The 'Analysis' tab can be used to upload the input file containing gene ids and their length in
the first and second column of a multi-column csv file, respectively. The third column onwards must contain read counts (see sample files on top-right corner of 'Analysis tab' ) |
-
| For the analysis to perform, the user has to specify: |
| | -the FPKM fold threshold (Default is 5) |
| | -the FPKM value threshold (Default is 1) |
| | -number of tissues in the input file (must match with the input file otherwise no results will be generated) |
| | -number of tissues to be consider for 'Group Enrichment' assignment (must be < number of tissues in the input file and greater than 1 otherwise no results will be generated) |
-
|
Once the analysis completed, the result will be emailed to the specified email ID.
(Note: Depending upon the size of input file, the running time may varies)
|
-
|
How to generate the read count matrix to be upload as input file?
Number of standard tools are already available to generate read count matrix. Some of them are enlisted here.
|
-
|
If you have aligned data (eg. .sam file)for raw reads and gtf file for your input gene/transcripts list you can use following tools to generate read count matrix:
|
|
FeatureCounts
HTSeq-count
|
-
| If you have assembled transcript or gene sequence and their raw data, following tools are well explained within Trinity help pages (https://github.com/trinityrnaseq/trinityrnaseq/wiki/Trinity-Transcript-Quantification )
for generating read count matrix
|
| |
RSEM
eXpress
Kallisto
salmon
|
| Sample file with Gene ID, length of gene and read count for each tissue |
 |
For any further help you can contact us. |